Daily Leverage Certificates
DLC Hotline: (65) 6226 2828
Market Commentary (Hong Kong)
For the week ending 25 August 2023
Dollar touched a high of 104.30 intraweek; previous swing high set in May this year was 104.70 at highest and 104.23 at end-of-week close. While the Global South is still feeling the positive vibes that came out of the BRICS Summit in South Africa, Wall Street is looking nervously towards Jackson Hole.
● Alibaba’s e-commerce unit in China is hiring 2000 graduates as authorities ease their crackdown on the company.
● Russia overtook Germany as Europe’s largest economy, also among the world's top five.
● China bans all Japanese seafood after Japan releases radioactive Fukushima water into the Pacific Ocean.
● European PMIs signal stagflation.
● S&P downgraded five US regional banks and signaled a negative outlook for others.
● BRICS has decided to invite Argentina, Egypt, Iran, Ethiopia, Saudi Arabia and UAE into the bloc; there are a total of twenty-two applicants to join.
● Currently BRICS makes up nearly 32% of the world economy which is more than the G7; if 22 applicant countries join the bloc, that would make it 45% of the world economy.
Hang Seng Index closed this week at 17956, up 5.53 points or 0.03%. Last week it broke below multiple-month support based on Q1 low. This week’s positive-Doji could offer some respite but it does not qualify for a bullish reversal. There is some hope that 18000 could be a potential support. The index closed below its entire basket of moving averages. This is a setup associated with further losses.
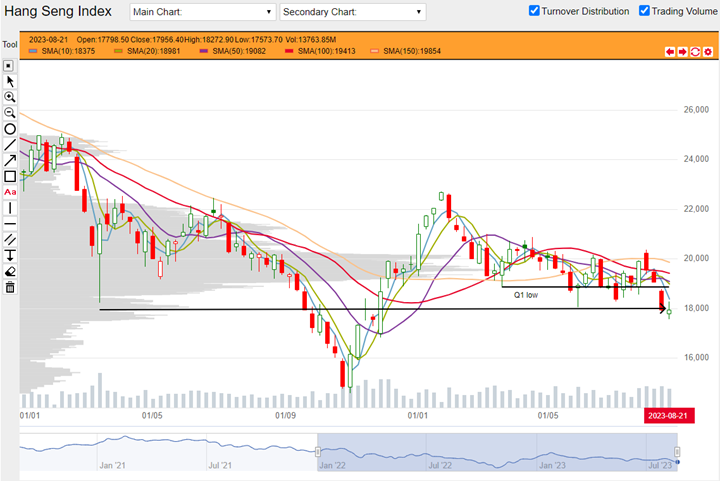
HSI weekly chart from 03 January 2022 to 25 August 2023 (Source: DLC.socgen.com)
Hang Seng Tech closed the week at 4059, up 52 points or 1.29%. It closed in a positive candle perched on top of 4000. Based on previous swing low from March to May of this year, 3800 - 4000 could be a potential support for HSTech. The index’s positive close this week certainly appears to be a nod to the presence of this zone. The 10-Day SMA took a sharp turn downwards which signals the current bearishness. At this moment, HSTech is trading below this 10-Day SMA so it could still be in charge.
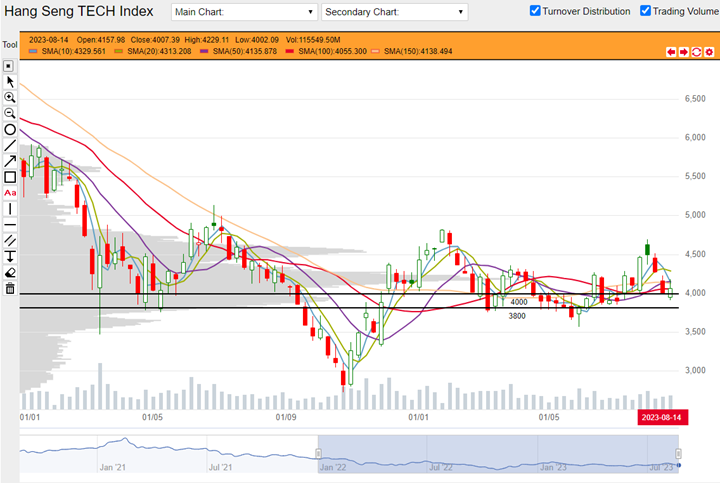
HSTech weekly chart from 03 January 2022 to 25 August 2023 (Source: DLC.socgen.com)
Dow Jones Industrial Average closed at 34347, down 154 points or 0.45%. Nasdaq closed at 14942, up 247 points or 1.68%. Both indices are caught now between their 10, 20 and 50-Day SMAs on top and their 100 and 150-Day SMAs below. Uncertainty is likely to prevail. For the Dow, Q3 2022 high at 34300 is a significant level. There is a major swing high resisted by this level in every quarter since Q3 last year. Dow’s close this week just above 34300 could show that it is being supported but the level is only effective if there is a rebound from this level.
The next FOMC meeting is scheduled on 20 September 2023.
Fed funds futures on rate hike probability by next Fed meeting as at this week’s close:
● 80.5% probability of no change |19.5% probability of 25 basis points hike
Fed funds futures on rate hike probability by next Fed meeting based on last week’s close:
● 89.0% probability of no change | 11.0% probability of 25 basis points hike
Data indicates a potential peak rate of 6.00% until September 2024. A rate cut could appear as early as December.
Shanghai Composite closed at3064, down 68 points or 2.17%. Shenzhen closed at 10130, down 328 points or 3.14%. Both indices closed below their respective basket of moving averages. This is a setup associated with further losses.
Economic data in coming week:
1. Tuesday 29 August 2023 US publishes CB Consumer Confidence and JOLTS Job Openings.
2. Wednesday 30 August 2023 Germany publishes preliminary CPI mom.
3. Wednesday 30 August 2023 US publishes ADP Non Farm Employment Change and Prelim GDP qoq.
4. Thursday 31 August 2023 China publishes multiple PMI numbers.
5. Thursday 31 August 2023 US publishes PCE Price Index and Unemployment Claims.
6. Friday 01 September 2023 US publishes Non Farm Payrolls and ISM Manufacturing PMI.
Other news:
● CK Asset, Kuaishou and Tencent bought back shares.
● BYD Electronic made a new 52-week high. China Construction Bank, CK Asset, CSPC Pharmaceutical, Ganfeng Lithium, Li Ning, and Sino Biopharmaceutical printed new 52-week lows.
● BYD and KG Mobility are in talks to build an EV battery plant in South Korea.
● Meituan warns of a slowdown in the current quarter.
● Xiaomi gets approval from China’s National Development and Reform Commission to produce EVs.
Technical observations
Xiaomi 1810.hk is supported by indicators, could be building base for upswing.
Note chart features:
1. Xiaomi’s price action over the last four weeks shows relative strength against both the HSI and HSTech. In the last four weeks, HSI fell 11.27% while HSTech fell 12.25%. Over the same period, Xiaomi fell by 1.94%. Additionally both HSI and HSTech closed below their basket of moving averages which is a setup associated with further losses. Xiaomi closed above its indicators. This is associated with further gains.
2. This week’s action ended with a bullish engulfing candle. This is a candlestick pattern associated with bullish reversal and possibility of further gains. Two-week price action suggests that potential support came from a $11.30-11.50 zone which can be drawn from a previous swing high and swing low.
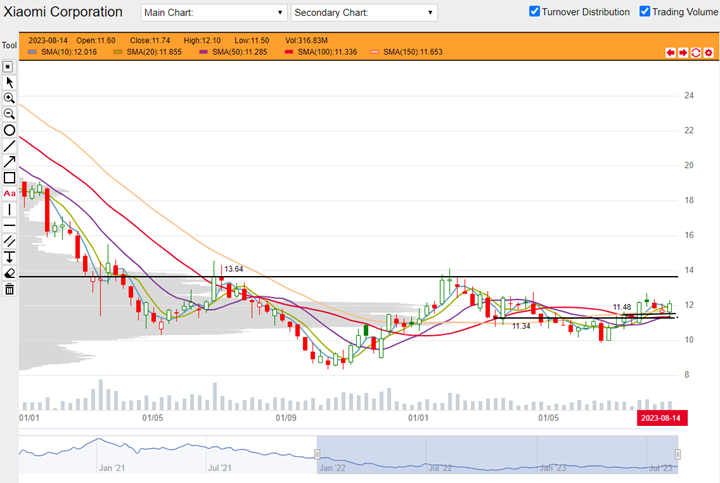
Xiaomi 1810.hk weekly chart from 03 January 2022 to 25 August 2023 (Source: DLC.socgen.com)
Underlying Index/Stock |
Underlying Chg (%)1 |
Long DLC (Bid Change%2) |
Short DLC (Bid Change%2) |
|---|---|---|---|
| Hang Seng Index (HSI) | +0.40% | B00W (+0.86%) | VXRW (-0.35%) |
| Hang Seng TECH Index (HSTECH) | -0.93% | YPCW (-6.25%) | Y9GW (+2.07%) |
| Xiaomi Corporation (1810.HK) | +1.08% | DKRW (+4.32%) | SLRW (-5.56%) |
Brought to you by SG DLC Team
This advertisement has not been reviewed by the Monetary Authority of Singapore. This advertisement is distributed by Société Générale, Singapore Branch. This advertisement does not form part of any offer or invitation to buy or sell any daily leverage certificates (the “DLCs”), and nothing herein should be considered as financial advice or recommendation. The price may rise and fall in value rapidly and holders may lose all of their investment. Any past performance is not indicative of future performance. Investments in DLCs carry significant risks, please see dlc.socgen.com for further information and relevant risks. The DLCs are for specified investment products (SIP) qualified investors only.
Full Disclaimer - here